Monitoring my cyberdeck: fixing the stale status on my telemetry display
Real-world troubleshooting: how a 30s interval broke the stale threshold of the Buddy telemetry and how a four-step proof chain separates the differences.
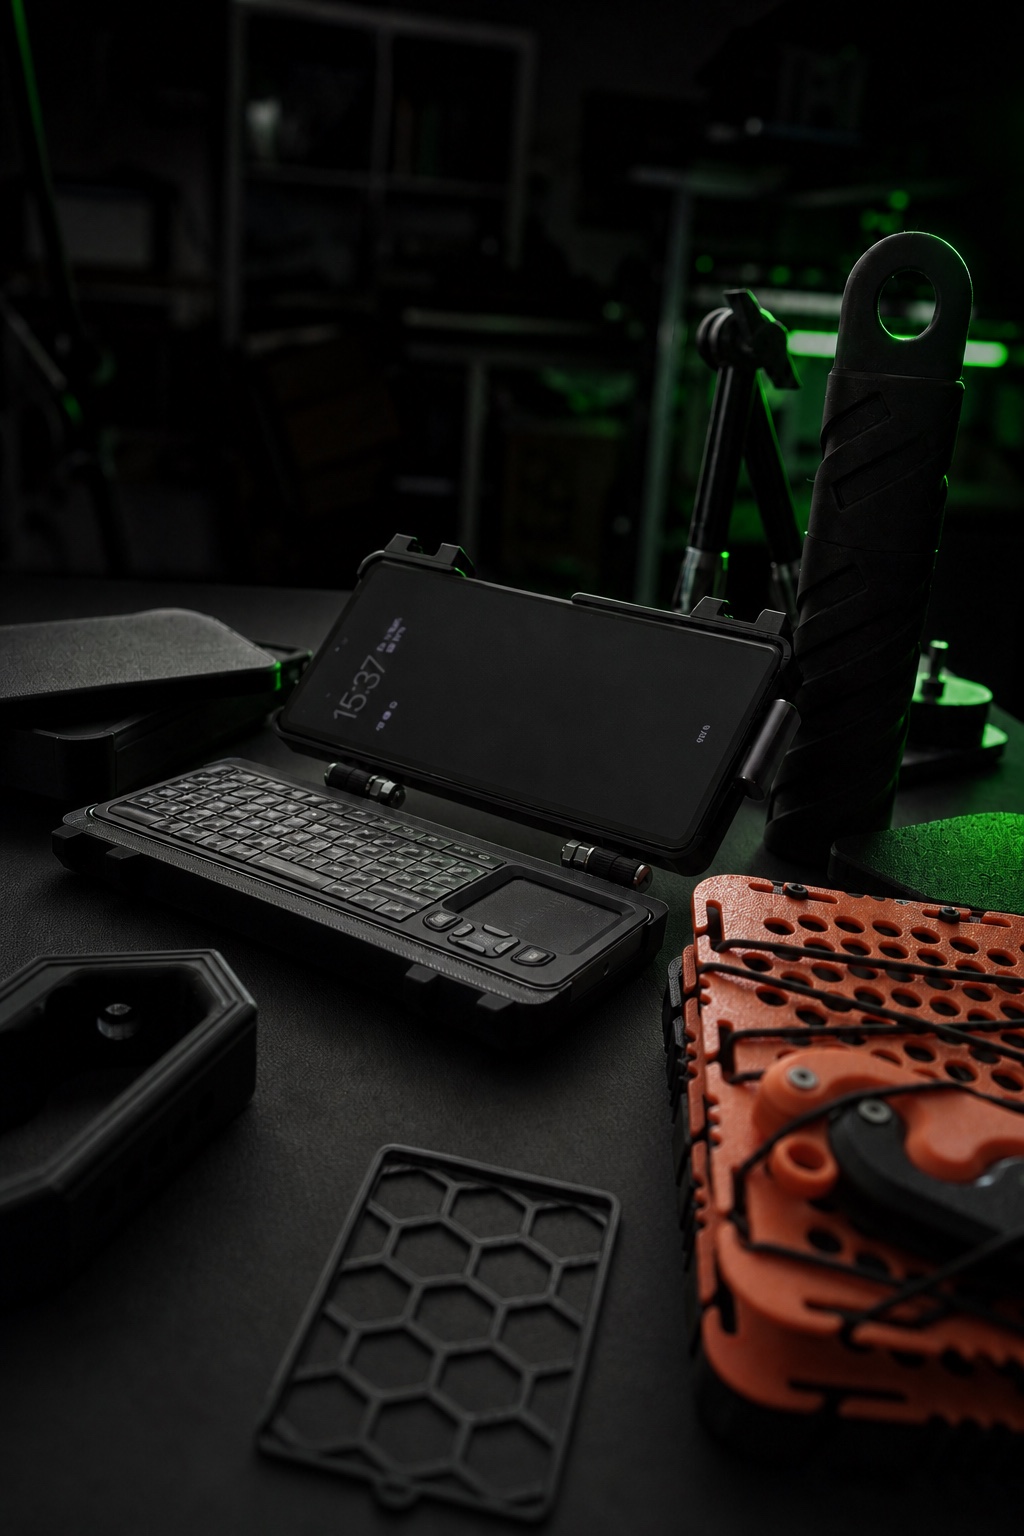
Kein fertiges Produkt und keine Hochglanz-Rückschau: Dieser Eintrag hält fest, was gebaut, getestet, verworfen und als Nächstes überprüft wird.
Monitoring my cyberdeck: fixing the stale status on my telemetry display
**Status: DRAFT, not for publication.** Troubleshooting based on our Buddy telemetry records of 29 October 2026. Editorial date: 3 November 2026. The title refers to the resolved server-side stale finding, not independently verified success on the physical display. Visual verification remains open; the completion report says Marcel is checking in parallel.
The symptom: readings arrived, but the status went stale
Monitoring my cyberdeck should answer a straightforward question: is it running now? Our Buddy setup produced something less straightforward. Telemetry arrived and a source appeared online, yet the reported state could still become `stale`. That sounds like a display problem. For troubleshooting, however, that description bundles together things we had not independently verified.
The documented observation concerns the receiver's status page, not a display transition I personally watched. The earlier investigation records changing source states; the completion report describes the timing conflict and subsequent GET checks. I therefore cannot honestly say that I watched the physical display flicker between states. The narrower finding is that successful transmission did not guarantee a continuously fresh status. [Q1, Q2]
In this context, `stale` does not automatically mean the sender has stopped. It means the receiver considers the available data too old. Old readings can still look entirely plausible. A believable memory value tells you little unless you also know when the receiver last accepted an update.
Four separate checks, not interchangeable evidence
**The sender is running.** An active service establishes that a process exists. It may still be talking to an unreachable destination, failing authentication, or taking longer than expected to complete each cycle. Process health and delivery success need separate evidence.
**The server accepts the data.** For that, inspect the response to an actual telemetry request. Our selected log entries contain `code=200 body=ok`. Those responses support successful requests at those moments. They do not establish freshness during a later check, and they certainly do not prove what the physical display rendered. [Q3, Q4; 29 October 2026]
**The data is fresh.** Check this at the receiving end. A successful request may already be old by the time someone reads the status. The question is whether that particular source remains current and whether subsequent updates reliably keep it current.
**The display actually shows it.** Neither a service status nor a POST log nor a browser response proves the final rendering. Independent observation of the physical device is needed to confirm presentation, source selection, and visible updates. That observation is missing from our completion record. Keeping these checks separate prevents a working transport from becoming an unsupported claim that the entire display was repaired. [Q1]
Diagnosis: the sending rhythm did not fit the freshness behaviour
The completion report records the timing conflict directly. `buddy-pulse.service` was active and its latest pulse was less than 30 seconds old, but the configured 30-second interval allowed the state to become `stale`. The documented change reduced the interval to 10 seconds. These timing figures come from the report dated 29 October 2026. [Q1]
That report does not specify the exact stale threshold. It cannot establish a particular firmware cutoff or a precise boundary second. The defensible conclusion is narrower: the previous sending rhythm was insufficient in the observed setup, and the receiver stayed online during the recorded checks after the change. This was not a fully isolated causal experiment, because another source also received a permanent sender during the intervention. [Q1]
The original pulse logs show what actually travelled through the request path. These extracts omit internal addresses and credentials. Times are UTC on 29 October 2026; every numerical value in the following blocks comes from the named original file. [Q3, Q4]
```text
buddy_pulse.log [Q3]
05:55:38,048432560 code=200 body=ok cpu=26.25 ram=24.76 ram_mb=692 ping=30.6 sess=1
05:55:50,498621715 code=200 body=ok cpu=28.0 ram=24.43 ram_mb=695 ping=2.87 sess=1
buddy_pulse_deck.log [Q4]
05:55:38,183626218 code=200 body=ok cpu=26.25 ram=24.76 rx=0.000000 tx=0.000000 ping=92.3 ram_mb=693 sess=1
05:55:50,342651562 code=200 body=ok cpu=28.00 ram=24.38 rx=0.000000 tx=0.000000 ping=9.39 ram_mb=696 sess=1
```
The field names require interpretation. Here, `cpu` is an indicator derived from load and processor count, not directly measured CPU utilisation. `ram` is a memory percentage, but the senders do not calculate it identically. `ram_mb` represents available memory rather than necessarily an agent's memory consumption. `ping` is obtained as a round-trip time in milliseconds. The scripts also contain fallbacks, so zero values must not automatically be presented as genuine measurements of inactivity. [Q5]
Why not repair registration first? The earlier investigation already showed that an accepted POST could make a source appear online while the other remained stale. That argues against a blanket missing-registration explanation. It does not prove the opposite claim that every source must be fresh for the display to work: the decision logic remains unknown. A changing status page suggests where to investigate; it is not a complete firmware specification. [Q2]
The timestamps need care too: they mark the beginning of each loop, not independently recorded server receipt. Gathering measurements and making the request take additional time. A configured sleep is therefore not the same thing as the actual gap between successful arrivals. [Q3 to Q5]
The fix: a shorter interval and persistent senders
According to the completion report, we changed the delay in `/usr/local/bin/buddy_pulse.sh` from 30 to 10 seconds and restarted its service. We also added `/usr/local/bin/buddy_pulse_deck.sh`, with a 10-second delay. Its unit is `/etc/systemd/system/buddy-pulse-deck.service`; the report records it as enabled and active, with the original service also active during verification. [Q1; 29 October 2026]
There is an important limit to this setup: the additional daemon ran on the Pi and submitted `source=deck`. That label does not establish that measurements originated on the Pixel cyberdeck. This exercised ongoing delivery and handling of different source names, not independently measured health across different physical computers. The Termux draft remained a separate file. [Q1, Q5]
Systemd provides a useful operating model here. A named service launches a known script, and its state can be inspected separately from receiver behaviour. On another installation, I would first match the unit to the actual executable and configuration. A service description is not evidence of the effective sending interval. Before changing anything, preserve the existing configuration and identify how to restore it if the change causes problems.
These commands are an inspection template for an appropriate system, not a new test performed for this article:
```sh
systemctl status buddy-pulse.service buddy-pulse-deck.service
systemctl cat buddy-pulse.service buddy-pulse-deck.service
journalctl -u buddy-pulse.service -u buddy-pulse-deck.service
```
During troubleshooting, keep the source name alongside each response status. Otherwise, a successful pulse from the original service can obscure a missing update from the additional sender. After a restart, do not stop at an active process: look for the matching log entry and then check the receiver. This is a recommended workflow, not an additional historical measurement from our experiment.
Keep authentication tokens out of published examples and screenshots. Sanitised response codes, timestamps, and source names are enough to explain the diagnosis.
GET verification: checking beyond a lucky response
The completion report records five consecutive GET checks. Each returned `Registered devices: 2` and listed both `kali-raspberrypi online` and `deck online`. The complete recorded sequence follows. All times and counts in this table come from that report, dated 29 October 2026, with times in UTC. [Q1]
| Time | Registered source labels | Status |
|---|---|---|
| 05:55:41 | 2 | both online |
| 05:55:51 | 2 | both online |
| 05:56:01 | 2 | both online |
| 05:56:12 | 2 | both online |
| 05:56:22 | 2 | both online |
This is stronger than a single successful response: the receiver's reported state stayed stable throughout the recorded sequence. It is not a long-duration reliability test or protection against later network faults. The registered-device count also establishes source registrations here, not independently proven physical measurement origins. [Q1]
The honest remainder: physical display verification is open
The physical display was not independently checked visually. The completion report says Marcel is checking in parallel, but this draft has no documented result from that check. Our demonstrated success therefore ends at the queried receiver interface. [Q1]
The exact firmware freshness threshold and complete `NO LINK` condition also remain unresolved. The earlier investigation explicitly warns against reconstructing that decision logic from firmware strings alone. Nor does the completion record document a controlled outage followed by recovery. These are limits of the result, not details to bury after claiming an end-to-end repair. [Q1, Q2]
A troubleshooting chain for any telemetry stack
Start by locating the sender and establishing where its measurements originate. Then inspect actual responses from the receiving service. Compare the real delivery rhythm with the documented stale rule, allowing for measurement time, network delay, and interruptions. If the threshold is unknown, record that uncertainty rather than inventing a number.
Next, read the status back repeatedly. Record timestamps and source states separately; an aggregate healthy state can conceal an outdated source. Comparing sources helps isolate problems only when their origins and measurement independence are understood. Another label on the same host provides a more limited test.
Finally, inspect the physical output and document what was actually visible. A controlled failure and recovery exercise in your own lab would be a useful next step, not something this article claims already happened. The most transferable improvement is methodological: sender activity, accepted delivery, fresh data, and visible rendering are different claims. Treat each as a separate test, and the next stale status becomes much easier to investigate honestly.
Nachgebaut oder getestet?
Teile deine Erfahrung mit genau diesem Build-Log. Reviews werden vor der Veröffentlichung moderiert.
Noch keine Reviews für diesen Eintrag.
Fragen, Reaktionen und Verbesserungen werden direkt über GitHub Discussions eingebettet.
GitHub-Bereich öffnen ↗